توضیحات
Reliability forecasting models for electrical distribution systems considering component failures and planned outages
بدلیل نداشتن داده های مقاله از داده های تصادفی استفاده شده
این مقاله از شبکه عصبی برای پیش بینی شاخص های قابلیت اطمینان با استفاده از داده های فنی شبکه قدرت توزیع استفاده کرده است و از آنالیز گری برای تشخیص ویژگیهای تاثیرگذار استفاده کرده است بدینصورت که براساس داده های فنی بصورت F1 تا F12
(1) F1: Ratio of available tie lines (%), ratio of the number of feeders in an EDS, which can be transferred to other feeders,
to the number of total feeders;
(2) F2: Ratio of cables (%), ratio of the length of cable feeders in an EDS to the total length of feeders;
(3) F3: Ratio of insulated feeders (%), ratio of the length of insulated feeders in an EDS to the total length of feeders;
(4) F4: Average length of each section (km/section), the total length of all feeders divided by the number of total sections
in an EDS;
(5) F5: Average number of customers in each section (customers/section), the number of total customers divided
by the number of total sections in an EDS;
(6) F6: Average number of circuit breakers of each feeder (breakers/feeder), the number of total circuit breakers divided by
the number of total feeders in an EDS;
(7) F7: Average number of transformers at each feeder (transformers/feeder), the number of total distribution transformers
divided by the number of total feeders in an EDS;
(8) F8: Average capacity of transformers at each feeder (MVA/feeder), total capacity of distribution transformers divided
by the number of total feeders in an EDS;
(9) F9: Ratio of tie lines (%), ratio of the number of feeders with tie lines in an EDS, to the number of total feeders;
(10) F10: Average number of switching devices at each section (devices/section), the number of total switching devices,
such as disconnect switches and sectionalizing switches, divided by the number of total sections in an EDS;
(11) F11: Average sections of each feeder (sections /feeder), the number of total sections divided by the number of feeders
in an EDS;
(12) F12: Average load factor of feeders (%), average load factor (the load of a feeder divided by the capacity of feeder) of
feeders in an EDS in a year.
برای شبکه توزیع و ارتباط فرمولیته با شاخص های قابلیت اطمینان از قبیل SAIFI SAIDI TCO TCOH با مدلسازی شبکه عصبی بمنظور پیش بینی شاخص های قابلیت اطمینان در یک شبکه شامل33 سیستم توزیع استفاده شده است که با توجه به نبودن مرجع دیتا , از یک دیتای کاملا تصادفی برای 10سال فرضی (2004-2013) استفاده شده است و برای بررسی تاثیرگزاری پارامترهای مهم بر شاخص قابلیت اطمینان پس از نرمال سازی دیتای مرجع از شاخص GRC و GRD بصورت زیر استفاده شده است
و بدین ترتیب برای تعیین تعداد نرون های لایه پنهان در شبکه عصبی 3 لایه از شاخص استانه GRD مطابق فلوچارت زیر
استفاده کرده و فرایند تخمین شاخص قابلیت اطیمنان TCOH بعنوان نمونه بصورت زیر است
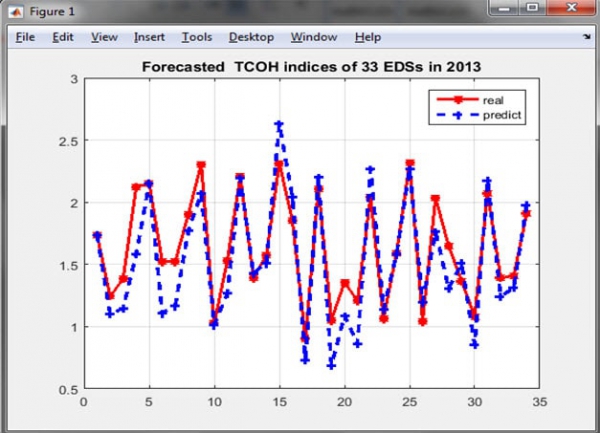
نتایج پیش بینی به ازای شاخص استانهGRD 0.4
نتایج پیش بینی به ازای شاخص استانهGRD 0.6
نتایج پیش بینی به ازای شاخص استانهGRD 0.5
نتیجه گیری : با شاخص 0.6 بهترین تقریب و پیش بینی با کمترین مقدار خطا حاصل شد.
کلید واژه :
Reliability forecasting, Electrical Distribution Systems (EDS), Influencing factors, EDS component failures, Planned outages, Artificial neural networks
شبیه سازی مقاله
Reliability forecasting models for electrical distribution systems considering component failures and planned outages
به تعداد محدودی قابل فروش می باشد.
سفارش انجام پروژه مشابه
درصورتیکه این محصول دقیقا مطابق خواسته شما نمی باشد،. با کلیک بر روی کلید زیر پروژه دلخواه خود را سفارش دهید.


